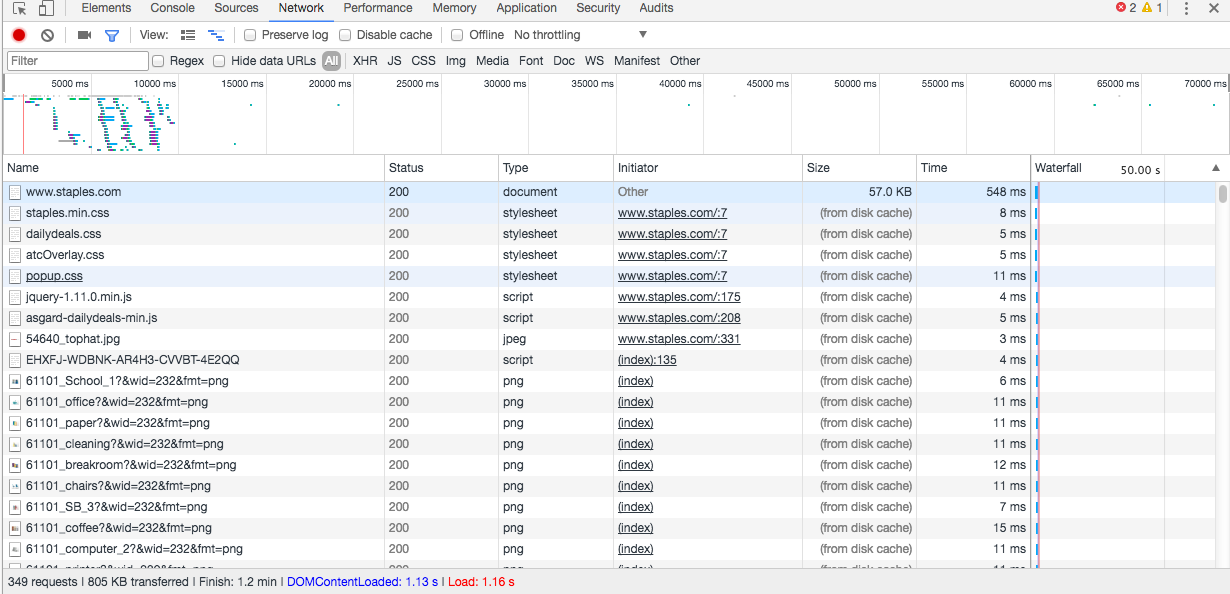
Onload time in firebug is double compare to chrome, firefox showing duplicates calls for css ,js and css acting as blocker. for: https://www.staples.com
On-load time in firebug is double as compare to the chrome, Firefox showing duplicates calls for css ,js and css acting as blocker. for: https://www.staples.com
We checked many times in Firefox and it is happening for all calls, check the attached screenshots.
所有回覆 (12)
Adding images.
I don't use Firebug. Could you compare the built-in Network Monitor? I am attaching a screenshot for comparison.
Note that you posted this with an old Firefox 34 release according to the user agent.
- Mozilla/5.0 (Windows NT 6.1; WOW64; rv:34.0) Gecko/20100101 Firefox/34.0
Does this still happen with the current release?
cor-el said
Note that you posted this with an old Firefox 34 release according to the user agent.Does this still happen with the current release?
- Mozilla/5.0 (Windows NT 6.1; WOW64; rv:34.0) Gecko/20100101 Firefox/34.0
I tested in firefox 32 , 34 and latest one also 54 but seeing the same behavior.
cor-el said
Note that you posted this with an old Firefox 34 release according to the user agent.Does this still happen with the current release?
- Mozilla/5.0 (Windows NT 6.1; WOW64; rv:34.0) Gecko/20100101 Firefox/34.0
Yes I checked in Network tool also seeing the double on load time as compare to chrome, will check again to verify. I tested Amazon site also seeing the same behavior. Don't know this is the generic behavior of firefox
jscher2000 said
I don't use Firebug. Could you compare the built-in Network Monitor? I am attaching a screenshot for comparison. https://developer.mozilla.org/docs/Tools/Network_Monitor
Thanks for testing as per your attached image looks like that no duplicate calls could you please share me the screenshot of on load time Thanks for replying.
sachintosachin said
Thanks for testing as per your attached image looks like that no duplicate calls could you please share me the screenshot of on load time
I don't understand what time you want to see.
jscher2000 said
sachintosachin saidThanks for testing as per your attached image looks like that no duplicate calls could you please share me the screenshot of on load timeI don't understand what time you want to see.
Please check the attached image of chrome dev tool we are seeing the on load time 1.16 sec mark in red same I want to know for firefox Network what is the value for on load time , could you please send me the screen shot.
I think you can generate that display yourself. ??
jscher2000 said
I think you can generate that display yourself. ??
Just now I took the display from that , Please see the attachment , please can you clarify my doubt here we are not getting duplicate calls, but if we check the red line vertically so can we consider that one for on load time, if we go with that it means our on load time is less than 2.56 sec but whenever I am checking on load time in firebug always getting 4 sec. so what you say about firebug its not good to check the performance.
Sorry, I haven't used Firebug for years. They do have some discussion sites where you can inquire. http://getfirebug.com/community
jscher2000 said
Sorry, I haven't used Firebug for years. They do have some discussion sites where you can inquire. http://getfirebug.com/community
Thanks I will go through this.


